Anomalies in Fluid's Behavior around the Critical Point: Delineation on the Phase Diagram
1. Introduction
It is now widely accepted that there exists an anomalous region in the vicinity of the critical point, which is characterized by large-scale variations in fluid properties, including the property reversals. As observed, flow oscillations, thermal fluctuations, and deteriorated heat transfer can occur within the anomalous region. Historical studies by pioneers such as Nishikawa and Widom have established the knowledge of fundamental inhomogeneity in the supercritical fluids and the existence of Widom line across which the fluid is in the supercritical liquid-like (SCLL) and supercritical gas-like (SCGL) states. This understanding of “anomalous region” has evolved from its conceptual origins (Jacyna, 1937) to the development of a novel, unified thermodynamic model today (Almara et al., 2025), as briefly outlined here.
2. Hypothetical Delimitation of the Anomalous Region
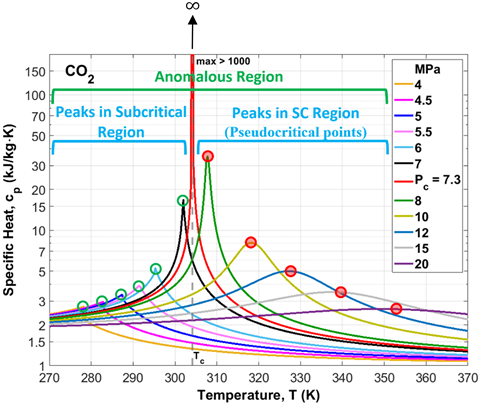
Indeed, anomalies are not limited to the critical point only but extend across a broader region, as evidenced by the existence of peaks in the isobars of specific heat and other properties before and after the critical point [Fig. 1(a) for carbon dioxide]. Indeed, in the vicinity of the critical point (\(P_c\), \(T_c\)), all fluids demonstrate substantial variations in their thermophysical properties, e.g., the density, dynamic viscosity, and thermal conductivity drop sharply. Conversely, the specific heat shows an initial increase with temperature, reaches its peak value, before declining and reverting to a monotonic behavior at high pressures and temperatures [Fig. 1(a)].
 |
 |
| (a) | (b) |
 |
|
| (c) | |
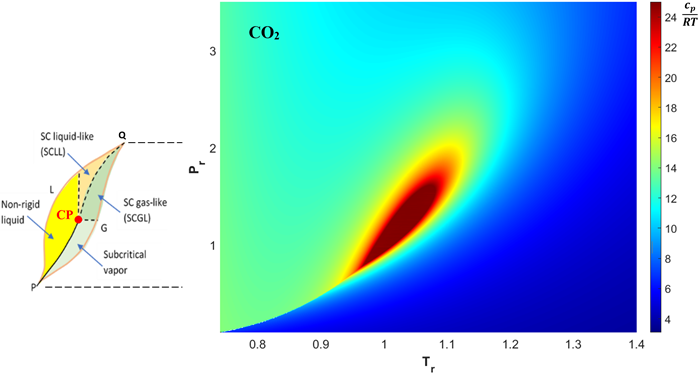
Figure 1. (a) Variation of coefficient of isobaric specific heat (\(c_p\)) with temperature for different isobaric lines, for carbon dioxide (CO2), showing the phase transition from subcritical liquid to supercritical state (Almara, 2025); (b) proposed phase diagram illustrating the anomalous region and its boundaries enclosed by PLQ and PGQ (Prasad et al., 2022); and (c) left: a zoomed-in view of the hypothetical delimitation of the anomalous region of (b), and right: top-view 3D visualization of the region near the critical point (CP) based on \(c_p\) for CO2 (Almara, 2025).
Figure 1(b) illustrates the hypothetical delimitation of the anomalous region proposed by Prasad et al. (2022). Their hypothesis is based on the argument that the anomalies in fluids originate in the subcritical region [Fig. 1(a)]; see for pressures below the critical pressure (\(P \lt P_c\))]. Indeed, the anomalous region begins somewhere between the triple point and the critical point and extends well into the SC region. Based on the knowledge of SCLL and SCGL states in the literature, Prasad et al. (2022) had proposed that the lines PLQ and PGQ [Fig. 1(b)] can delineate the anomalous region. The region between these two lines encompasses the non-rigid liquid and vapor in the subcritical domain, and the SCLL and SCGL states in the SC region. The SCGL state ends at line PGQ, beyond which (on the right), the supercritical state exhibits no large-scale variations and inversions in the properties. Similarly, on the subcritical side, the fluid does not display any anomalous behavior to the right of PGQ. Similarly, to the left of line PLQ, the fluid is in a (rigid) liquid state. Note that, on a conventional phase diagram, point P is directly connected to the critical point through the liquid-vapor phase change line [black solid line in Fig. 1(b)]. Also, note the similarity in the shapes between the hypothetical diagram of the anomalous region in Fig. 1(b) and the top-view 3D visualization (based on the thermodynamic model) of the region near the critical point, based on the isobaric specific heat in Fig. 1(c, right). The plots are generated using data from the NIST's REFPROP (Lemmon et al., 2018; Huber et al., 2022).
3. Anomalous RegionIntroduction
3.1 Delimitation
To delineate the anomalous region from the subcritical liquid to supercritical fluid, a thermodynamic model based on Gibbs free energy, \(g\), has been recently developed by Wang et al. (2024), which leads to three governing parameters. They are specific heat parameter, \(c_p^*\) (\(= c_p/T\)), isobaric thermal expansion parameter, \(\beta^*\) (\(= \nu\beta\)), and isothermal compressibility parameter, \(\kappa^*\) (\(= \nu\kappa\)). The Nishikawa's condition that \(d^3g =\) 0 at the critical point, leads to two extrema (maxima and minima) of these parameters; traditionally only the maxima have been reported for \(c_p\), \(\beta\), and \(\kappa\) (Fig. 2). The loci of these extrema for \(c_p^*\), \(\beta^*\), and \(\kappa^*\) form closed loops on the (\(P\), \(T\)) phase diagram. Collectively, these three loops delineate the anomalous region (ABCDEA), as shown in Fig. 2. The analysis also redefines the critical point as the state where the fluid anomalies are maximal and the three governing parameters approach infinity. On the other hand, these anomalies vanish entirely outside the ABCDEA boundary.

Figure 2. Anomalous region (ABCDEA, shaded area) for carbon dioxide (Wang et al., 2024)
Almara et al. (2025) have provided the reduced pressures and temperatures for points A, B, C, D, and E to delineate the anomalous region for several fluids, including hydrogen, neon, argon, krypton, xenon, methane, nitrogen, ethane, carbon dioxide, propane, carbon monoxide, ammonia, water, ethylene glycol, and R134a. Notably, water is an exception where points E and A coincide, resulting in the absence of a distinct EA curve. However, helium, ethanol, and methanol are excluded because their anomalous regions could not be distinctly identified, as discussed in Section 3.2. For regular fluids, the uppermost \(P_r\) value of B ranges from 3.228 to 3.8017 which agrees well with the prediction of \(P_{r,\max} \gt\) 3 (Banuti, 2015).
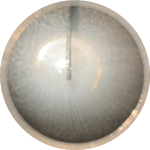
Recent, carbon dioxide critical point experiments (Chakra et al., n/d) have led to the visualization (Fig. 3) of the fluid's behavior within the anomalous region, covering the transition from the SCGL to subcritical liquid/liquid-like states. The process of densification and stratification of the SCGL state (indicated by larger density fluid at the bottom of the cylindrical chamber) is evident in Fig. 3 that exhibits the transition from the initial pressure of 9.31 MPa and temperature of 316.00 K [Fig. 3(a)] down to 7.33 MPa and 304.30 K [Fig. 3(d)]; being (b) the most close to the critical point: \(P_c =\) 7.3773 MPa and \(T_c =\) 304.128 K.
 |
 |
 |
 |
| (a) | (b) | (с) | (d) |
Figure 3. Photographs at different pressures and temperatures in the vicinity of the critical point for carbon dioxide. (a) 9.31 MPa, 316.00 K, (b) 7.37 MPa, 304.60 K, (c) 7.30 MPa, 304.10 K, and (d) 7.03 MPa, 302.80 K.
3.2 Special Fluids
While helium, ethanol, and methanol exhibit thermophysical behaviors similar to the other fluids as noted above, their anomalous regions are significantly more complex (Almara et al., 2025; Almara, 2025). In the case of helium, this complexity arises despite its simple monatomic structure, from the quantum effects at low temperatures (Almara et al., 2025). For ethanol and methanol, the complexity of the boundary loops is compounded by their polar nature; these molecules exhibit strong hydrogen bonding due to the presence of the hydroxyl (–OH) group (Almara et al., 2025). These strong, directional intermolecular forces result in unique thermophysical properties that are not fully accounted by the simple molecular models.
3.3 Representative Correlation
Almara et al. (2025) have also obtained specific correlations to delimitate the anomalous region for fifteen polar and non-polar fluids, as noted in Section 3.1. To construct the curved boundaries of this region (AB, DE, EA, and DA as illustrated in Fig. 2), a fourth-order polynomial is employed. The remaining boundaries, BC and CD, consist of linear segments defined by known coordinates. Line BC is a horizontal segment at a constant reduced pressure at point B to C, whereas the segment CD is a linear interpolation defined by points C and D.
The boundaries of the anomalous regions for above mentioned fluids, excluding neon, water, hydrogen, and ethylene glycol, exhibit a remarkable degree of similarity. Consequently, it is useful to consolidate these closely aligned regions into a unified diagram, represented by the thick light-green lines in Fig. 4. The increased thickness of these lines toward the upper-right corner of the plot reflects the regions where deviations are at their maximum. A generalized approximation of this shaded green area is delineated by the solid black boundary, which is characterized by a set of fourth-order polynomials (Almara et al., 2025). This analytical boundary provides a robust initial framework for the design of supercritical engineering systems involving simple or regular fluids.
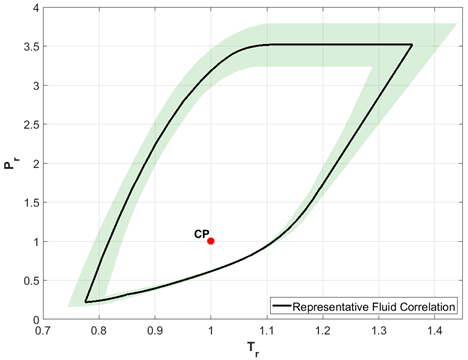
Figure 4. Representative correlation (solid black line) for the anomalous regions of regular fluids as mentioned in Section 3.1, excluding neon, water, hydrogen, and ethylene glycol
4. Conclusions
The anomalous region that exists in the vicinity of the critical point, has been delimited on the P-T phase diagram, for the first time, using the thermodynamic parameters, \(c_p^*\), \(\beta^*\), and \(\kappa^*\). It is characterized by the three distinct closed loops that extend from the subcritical to supercritical regions. However, complex fluids like helium, ethanol, and methanol exhibit significant departures from this generalized behavior. To assist in engineering applications of the SC fluids, the boundaries of these regions are mathematically defined using fourth-order polynomials. For most regular fluids, these boundaries are remarkably similar, which allows for a generalized representative correlation, which can serve as an initial approximation in the design of the supercritical systems.
Indeed, the present delineation of anomalous states should be of great value to the design and development of ultra-high capacity, super energy-efficient, and environmentally superior supercritical systems, whether the goal is to avoid the ill-effects of anomalies in the working fluid, or to take advantage of the anomalies in special cases. The systems passing through the anomalous states would require far more complex design considerations. It is to be noted that both the subcritical and compressed liquid systems experience anomalous behavior in a range of pressure and temperature around the critical point, and as such, those systems would also require the consideration of fluid anomalies.
REFERENCES
Almara, L.M. (2025) Supercritical Fluids: Critical Point, Anomalous States, and Transport Behavior, PhD, University of North Texas, Denton.
Almara, L.M., Wang, G.X., and Prasad, V. (2025) Thermodynamic Behavior of Polar and Nonpolar Fluids Within and Beyond the Anomalous Region: Similarities, Deviations, and Universal Compressibility Points, Phys. Fluids, 37(10): 106114.
Banuti, D.T. (2015) Crossing the Widom-Line – Supercritical Pseudo-Boiling, J. Supercrit. Fluids, 98: 12–16.
Chakra, C.B., Almara, L.M., Bostanci, H., and Prasad, V. (n/d). Work in progress.
Huber, M.L., Lemmon, E.W., Bell, I.H., and McLinden, M.O. (2022) The NIST REFPROP Database for Highly Accurate Properties of Industrially Important Fluids, Ind. Eng. Chem. Res., 61(42): 15449–15472.
Jacyna, W. (1937) Note on the Mathematical Foundation of the Thermodynamical Equation of State, Phys. Rev., 51: 677.
Lemmon, E.W., Bell, I.H., Huber, M.L., and McLinden, M.O. (2018) NIST Standard Reference Database 23: Reference Fluid Thermodynamic and Transport Properties-REFPROP, Version 10.0.
Prasad, V., Kakroo, K., and Banerjee, D. (2022) Existence of Supercritical “Liquid-Like” State in Subcritical Region, Optimal Heat Transfer Enhancement, and Argon as a Non-Reacting, Non-Corroding SC Heat Transfer Fluid, Heat Transf. Res., 53(9): 1–27.
Wang, G.X., Almara, L.M., and Prasad, V. (2024) Thermodynamic Analysis of Anomalous Region, Critical Point, and Transition from Subcritical to Supercritical States: Application to van der Waals and Five Real Fluids, Phys. Fluids, 36(2): 026105.
参考文献
- Almara, L.M. (2025) Supercritical Fluids: Critical Point, Anomalous States, and Transport Behavior, PhD, University of North Texas, Denton.
- Almara, L.M., Wang, G.X., and Prasad, V. (2025) Thermodynamic Behavior of Polar and Nonpolar Fluids Within and Beyond the Anomalous Region: Similarities, Deviations, and Universal Compressibility Points, Phys. Fluids, 37(10): 106114.
- Banuti, D.T. (2015) Crossing the Widom-Line – Supercritical Pseudo-Boiling, J. Supercrit. Fluids, 98: 12–16.
- Chakra, C.B., Almara, L.M., Bostanci, H., and Prasad, V. (n/d). Work in progress.
- Huber, M.L., Lemmon, E.W., Bell, I.H., and McLinden, M.O. (2022) The NIST REFPROP Database for Highly Accurate Properties of Industrially Important Fluids, Ind. Eng. Chem. Res., 61(42): 15449–15472.
- Jacyna, W. (1937) Note on the Mathematical Foundation of the Thermodynamical Equation of State, Phys. Rev., 51: 677.
- Lemmon, E.W., Bell, I.H., Huber, M.L., and McLinden, M.O. (2018) NIST Standard Reference Database 23: Reference Fluid Thermodynamic and Transport Properties-REFPROP, Version 10.0.
- Prasad, V., Kakroo, K., and Banerjee, D. (2022) Existence of Supercritical “Liquid-Like” State in Subcritical Region, Optimal Heat Transfer Enhancement, and Argon as a Non-Reacting, Non-Corroding SC Heat Transfer Fluid, Heat Transf. Res., 53(9): 1–27.
- Wang, G.X., Almara, L.M., and Prasad, V. (2024) Thermodynamic Analysis of Anomalous Region, Critical Point, and Transition from Subcritical to Supercritical States: Application to van der Waals and Five Real Fluids, Phys. Fluids, 36(2): 026105.